Market Insights: Friday, January 17th, 2025
Market Overview
U.S. markets closed the week on a high note, driven by a resurgence in tech stocks and optimism ahead of Monday's inauguration holiday. The Dow Jones Industrial Average gained 0.8%, leading a day marked by strong performances in growth sectors. The S&P 500 rose 1%, while the Nasdaq Composite surged 1.5%, bolstered by a rebound in Nvidia and Tesla, which climbed over 3% each. Weekly gains were robust, with the Dow up 3.7%, the S&P 500 adding 2.9%, and the Nasdaq advancing 2.4%. Investors drew confidence from key economic data, including better-than-expected housing starts and industrial production figures. Additionally, inflation data and strong bank earnings reinforced the narrative of a steadily improving economic backdrop, while expectations of future rate cuts continued to buoy sentiment. Ahead of Monday’s closure, investors also turned their attention to potential policy impacts from President Trump’s second term, particularly regarding trade and fiscal strategies.
SPY Performance
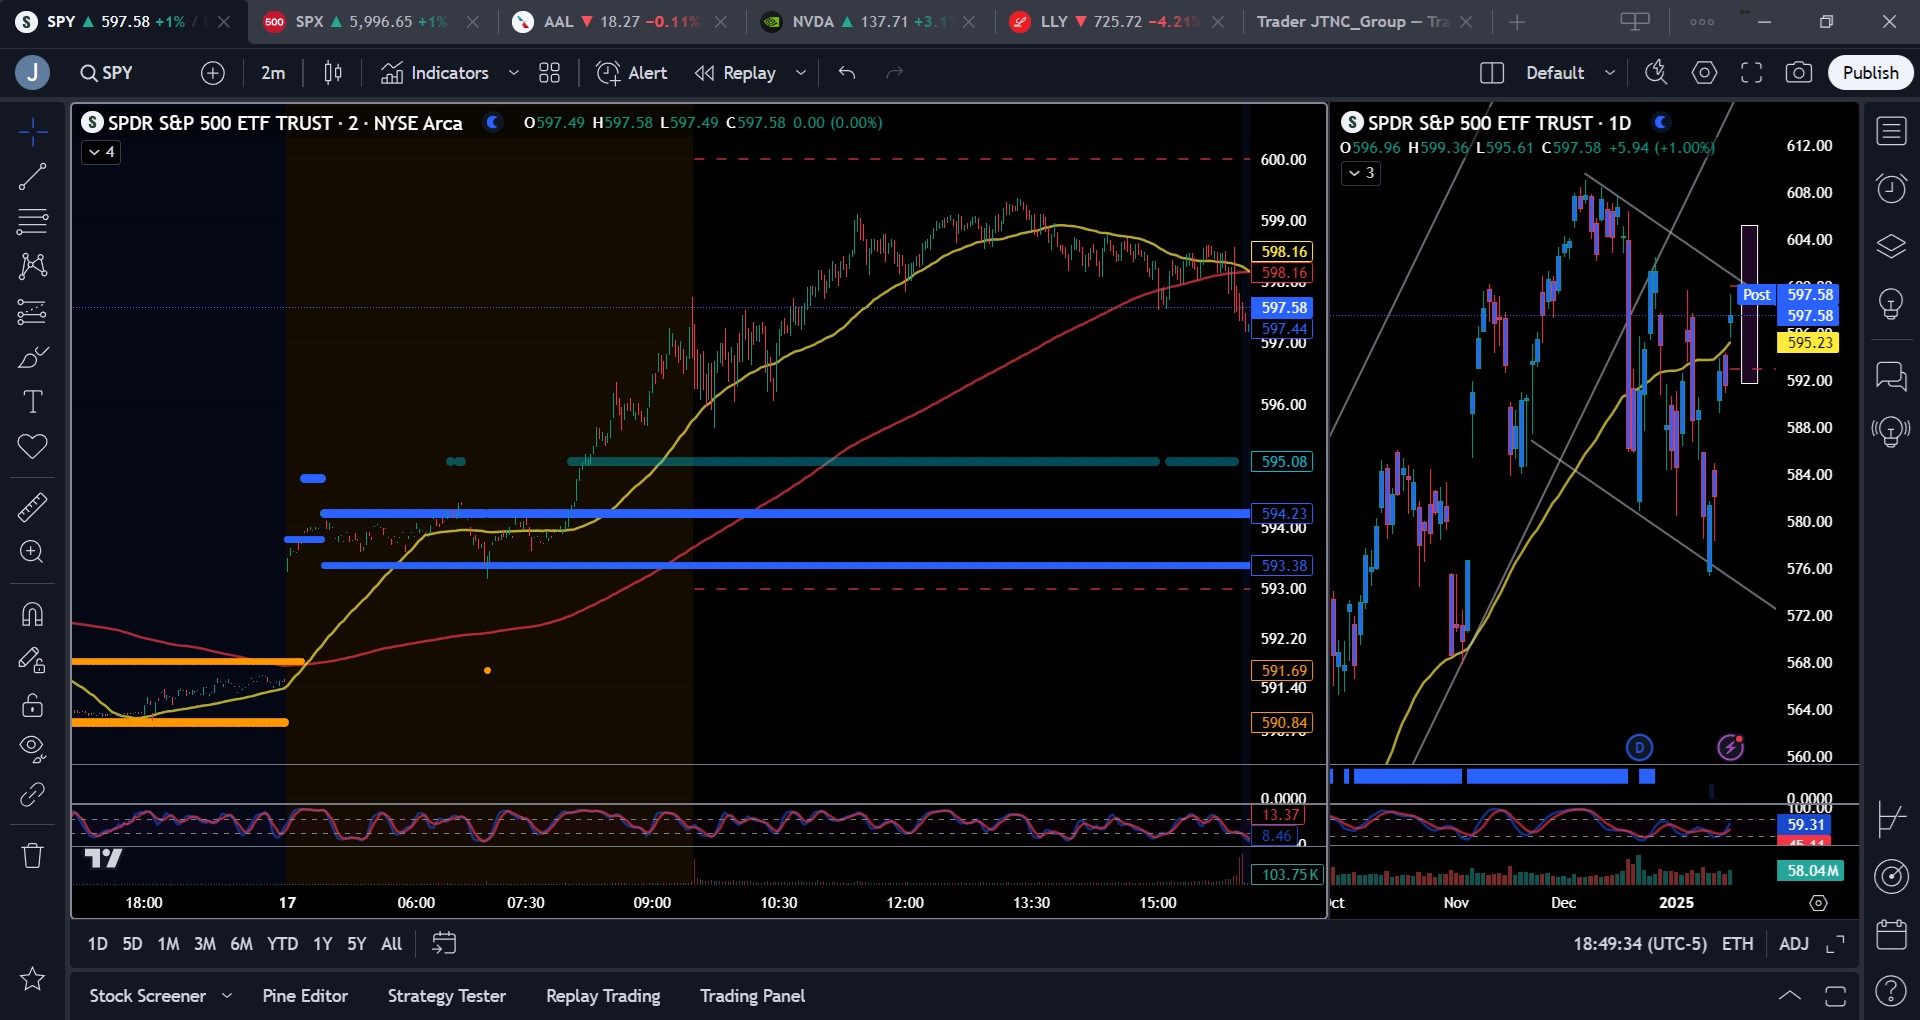
SPY posted a solid gain of 1%, closing at $597.58 after touching a high of $599.36. The ETF opened at $597.17 and traded as low as $595.61 before climbing steadily through the session. Trading volume was slightly above average, reflecting increased participation ahead of the holiday weekend and monthly options expiry. The day's performance underscored bullish momentum, with SPY comfortably above critical support levels and pushing closer to key resistance near $600.
Major Indices Performance
The Nasdaq led the charge with a 1.56% gain, as growth stocks bounced back strongly. The Dow followed with a 0.78% increase, bolstered by industrial and consumer discretionary sectors. The S&P 500 rose 1%, benefitting from broad-based strength, particularly in technology. The Russell 2000 added 0.43%, demonstrating resilience in small-cap stocks. Defensive sectors, including utilities and healthcare, underperformed, reflecting investors’ shift toward riskier assets. The day's rally was fueled by optimism surrounding economic resilience, tech recovery, and rate cut expectations.
Notable Stock Movements
The "Magnificent Seven" tech stocks had a stellar day, led by Nvidia and Tesla, both surging over 3%. Apple rebounded 0.7%, recovering from earlier losses. Other chipmakers like Micron joined the rally, with gains reflecting renewed investor confidence in tech. Bitcoin’s continued rise above $100,000 further lifted sentiment for crypto-linked stocks, including Coinbase. The recovery in tech heavyweights marked a decisive shift in sentiment following a challenging week for the sector.
Commodity and Cryptocurrency Updates
Oil prices edged down 0.49%, closing at $77.47 per barrel, as concerns about demand growth persisted. Gold slipped 0.43% to settle at $2,738 per ounce, reflecting reduced haven demand amid a risk-on market environment. Bitcoin soared 4.83%, closing just below $105,000, fueled by robust buying interest and optimism about crypto's role in diversifying portfolios. Diverging trends in commodities and cryptocurrencies highlight shifting investor preferences as markets adapt to evolving macroeconomic dynamics. We continue to believe Bitcoin will move substantially higher but believe a pullback toward $83,000 and further to $77,000 provide better entry levels.
Treasury Yield Information
The 10-year Treasury yield rose slightly by 0.33% to close at 4.621%. Despite this increase, yields remain challenged yet below critical thresholds, providing support for equities. However, any move toward 5% would likely pressure stocks, with 5.2% seen as a tipping point for a significant market correction. The moderate rise in yields reflects stable inflation expectations and reduced fears of immediate monetary tightening.
Previous Day’s Forecast Analysis
Thursday’s forecast projected a range of $588 to $595, with a bias toward consolidation and sporadic trending moves. Key resistance levels were identified at $595 and $600, while support was expected at $588 and $585. The strategy emphasized trading cautiously around key levels, favoring failed breakout patterns and failed breakdown patterns for entry opportunities. SPY was projected to drift lower overnight but find support and rally. We stated the “bulls are in control of the market above $585 therefore the model’s general lean is further consolidation which will lead to a next leg higher.”
Market Performance vs. Forecast
With the market opening above major resistance, these levels become support and as such, $595 became a level to enter long, looking for a rally to major resistance at $598 and $600. These levels did in fact hold and SPY’s Friday performance closely aligned with Thursday’s projections. With the ETF opening at $597.17, surpassing the $595 resistance level early and testing highs near $600, support held firm above $595, validating the bullish bias outlined in the forecast. Traders who followed the forecast capitalized on upward momentum and predictable reversals at key levels, with long trades around $595 yielding significant gains.
Premarket Analysis Summary
Today’s premarket analysis highlighted $593 as a pivotal bias level, with targets above at $597 and $600. Key support levels were noted at $593, $591.75, and $590. The analysis accurately anticipated an upward bias, with the market showing resilience above $593 and climbing steadily toward resistance. The cautious approach advised for erratic price action proved prudent, as the market’s move higher was measured rather than aggressive.
Validation of the Analysis
The premarket analysis proved reliable, with SPY adhering to the outlined range and key levels. Resistance at $597 and $600 guided price action, while support at $593 provided a strong base. Opportunities for both long and short trades arose at these levels, affirming the accuracy of the analysis. Traders who followed the recommendations benefitted from well-anticipated movements, particularly the breakout above $593.
Looking Ahead
With markets closed Monday for the holiday, attention will shift to next week’s data releases. Thursday and Friday will feature significant economic updates, including Unemployment Claims and PMI, which could influence Federal Reserve policy expectations. The absence of immediate catalysts suggests subdued trading early next week, though policy developments from the new administration could introduce significant volatility.
Market Sentiment and Key Levels
SPY’s close at $597.58 signals bullish momentum heading into next week, with resistance at $600, $604, and $605, and support at $595 and $590. Bulls remain in control above $595, with potential to push toward new highs. However, a drop below $590 could shift sentiment bearish, targeting $585 or lower while a move above $600 clears the way to $605.
Expected Price Action
The model forecasts a trading range of $595 to $604 for Tuesday, favoring an upward bias. Key resistance levels include $600 and $604, while support lies at $595 and $590. Bulls are likely to dominate above $595, with targets at $600 and beyond. A failure to hold above $590 could lead to retracement toward $585. Traders should remain vigilant for erratic moves, especially near key levels. We expect price on Sunday and Monday night to retest today’s highs and possibly exceed them on the way to $600. A failure to push to $600 will indicate a likely market peak for Tuesday.
Trading Strategy
For Tuesday, focus on long trades above $595, targeting $600 and $604. Short trades can be initiated at resistance near $604 and $605, with stops placed tightly to mitigate risk. The VIX suggests elevated caution, so position sizes should remain moderate. Failed breakout and failed breakdown patterns around key levels offer high-probability entries, emphasizing a disciplined approach. The expected range is wide and therefore market participants are implying volatility from the new administration as early as Tuesday. Traders are advised to stay on top of not only economic releases but policy news coming out of new administration which may affect the markets. Its likely the next four years will have more days where trading what you see from these types of events is more prevalent.
Model’s Projected Range
The projected maximum range for Tuesday of $591.75 to $605.25 suggests a trending market dominated by Call activity. Resistance at $600 and $604 aligns with bullish momentum, while support at $595 and $590 provides a foundation. SPY remains the bear channel formed on December 18th which will be void should price close above $600 a few days in a row. Watch for market behavior at this level for clues of what will likely follow. Traders are advised to monitor these levels closely against the current bear trend channel for potential breakouts or reversals.
Market State Indicator (MSI) Forecast
Current Market State Overview:
The MSI is currently in a Bullish Trending Market State, with price closing well above support and extended targets. The MSI range is narrow, yet extended targets printed all session indicating a strong bull trend. With SPY closing near the day’s highs, price is likely to experience some follow through on Sunday and Monday night. The MSI has not rescaled all day which is unusual after such a strong move. Before the open SPY rescaled from a bearish state through a ranging state to a bullish state quickly and started printing extended targets. This began at 8 am ET and was a signal that the market would rally and rally hard. Price was at $595 at that time. By the open, SPY had traded up to $597 and with the MSI printing extended targets continually, price had nowhere to go but straight up. We suspect the market will settle down after today given monthly options expire and the short squeeze may slow as it reaches $600. We also suspect the MSI will rescale to provide more information on the strength of the current bull trend. MSI support is $594.23 and lower at $593.38.
Key Levels and Market Movements:
SPY moved markedly higher overnight, breaking above major resistance at $595. We stated yesterday as “long as $585 does not give way, price will push toward $600”. While we thought today might have more consolidation than trending behavior, with the large move premarket, the short squeezed continued with shorts having to cover prior to options expiry. As such SPY powered higher, moving much closer to major resistance at $600. With price opening above $595, this level became support and a less than perfect failed breakdown at 9:42 am ET had us long looking for our next resistance level at $598. SPY got there by 11 am and with extended targets printing, we decided to hold our runners to see if price would push toward $600. A double top and failed breakout at 1:20 pm ET had us close our long and sit on our hands for the rest of the day. With extended targets printing all day, the MSI kept us out of any shorts. And while price did pull back slightly, we trade probabilities and probabilities for the MSI with extended targets tell us to never fade a trend as long as the MSI is printing extended targets. Today ended with one solid trade which again, is enough to pay the bills and earn a substantial living. The MSI continues to provide actionable information to assist traders in staying on the right side of the market and with the prevailing trend. We highly recommend integrating the MSI into your trading arsenal to maximize your long-term success.
Trading Strategy Based on MSI:
Markets are closed Monday and forecasting out several days is less accurate than forecasting out overnight. Our model for Tuesday sees some follow through to today’s rally with a retest of today’s highs with SPY perhaps reaching $600. At $600 we expect the bears to try to push prices back below $595 to keep the bear trend channel intact. Without any major economic news, the only other external catalyst for Tuesday is the incoming administration and the news that may produce. The model projects a wide range for Tuesday so trending behavior is likely. But we suspect the market stalls at $600 so we favor fading this level and retests of today’s highs on failed breakouts, while also looking for longs from major support at $595. While there is also support at $598, we would only consider longs from this level on a failed breakdown. After four straight up days, this is our least favorite time to trade as the market needs time to consolidate and digest gains before deciding where to go next. January historically is strong so it’s likely we end the month on a positive note. But February on the other hand can be quite dicey. Bulls are firmly in control so favor longs over shorts above $595 and watch to see if $600 becomes the battleground for the bulls and the bears. We see this as the most likely scenario which will allow for two-way trading from the edges, trading level to level. Watch the MSI closely to identify the trend and key levels to trade to ensure alignment with prevailing market conditions. If you do not have this tool, we highly suggest contacting your representative to secure a copy.
Dealer Positioning Analysis
Summary of Current Dealer Positioning:
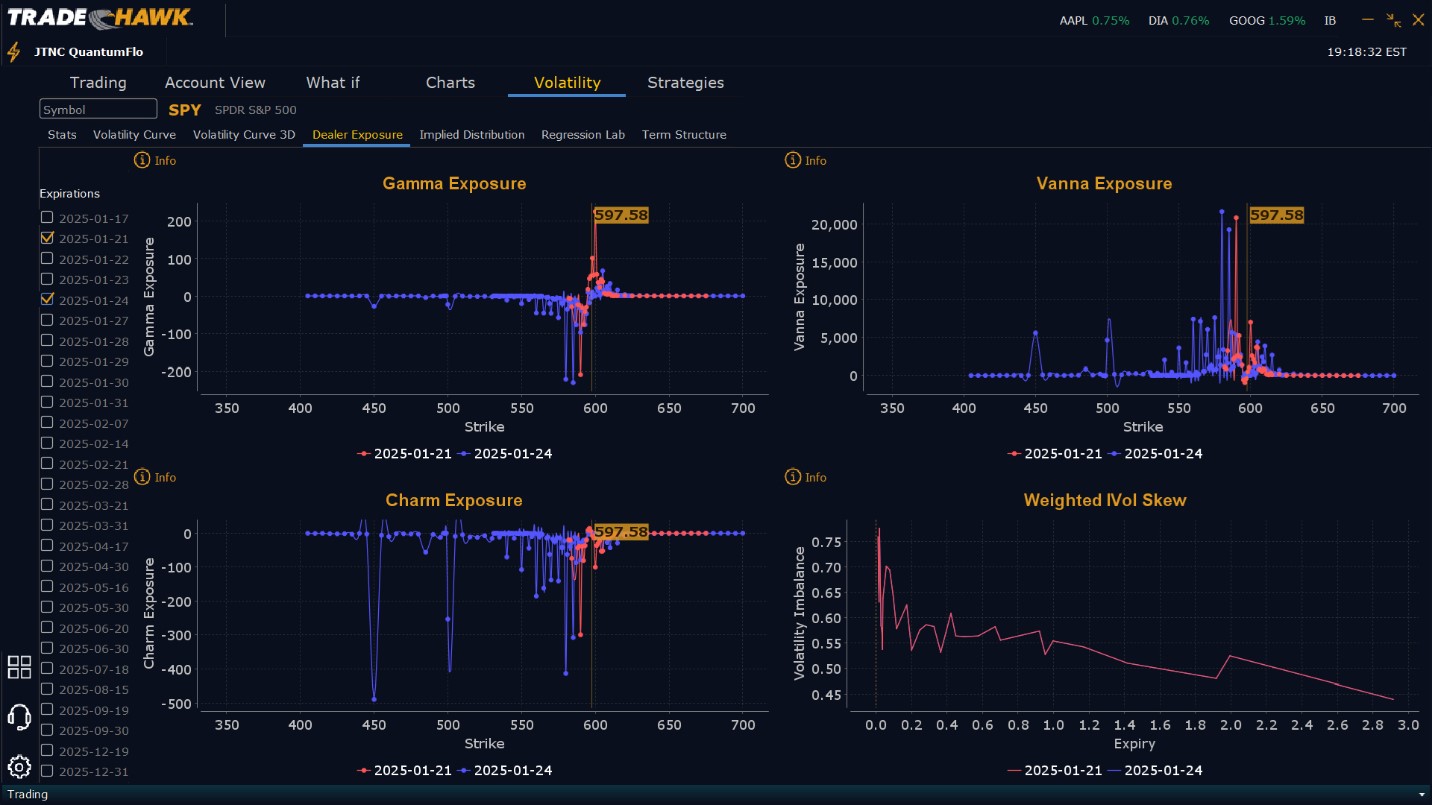
Dealers are selling $598 to $604 and higher strike Calls implying the Dealers believe there is a ceiling to the current rally on Tuesday at $600. To the downside Dealers are buying $597 to $580 and lower strike Puts in a 2:1 ratio to the Calls they are selling, implying a neutral outlook for Tuesday. This is unchanged from today reflecting Dealers belief that the relief rally will likely stall on Tuesday but the market is unlikely to decline.
Looking Ahead to Next Friday:
Dealers are selling $598 to $610 and higher strike Calls while buying $594 to $597 Calls indicating their desire to participate in any market rally to as high as $610 by the end of next week. $605 appears to be the ceiling for the week, however. To the downside, Dealers are buying $593 to $560 and lower strike Puts in a 4:1 ratio to the Calls they are selling/buying, reflecting a bearish view for next week. This bearish posture remains the same as today but with less strength than the 6:1 ratio coming into the day. While not overly bearish, above 3:1 Dealers are showing some concern over lower prices. Dealers have reduced some of their protection but that may also be as a result of monthly OPEX. Dealers are certainly prepared for any market decline that may develop and we suggest any long book take the opportunity to do the same. Dealer positioning changes daily so it’s essential to monitor these updates each day for shifts in sentiment.
Recommendation for Traders
With next week’s expected volatility, focus on key levels at $595 and $600. Long trades above $595 targeting $600 and $604 are favored, while short trades at resistance near $604 can be considered. Use tight stop-losses and adjust positions based on market behavior. While the bulls have complete control of the market, what transpires at $600 is key to what comes in February. Purchasing downside protection is a good idea if you have profits to protect. But at least for
Tuesday, we slightly favor longs over shorts given the strength of the recovery off the lows set just a few days ago. But when we say slightly, we mean our models require more price discovery to determine what comes next, therefore we advise caution initiating new longs at these levels. Be sure to review the premarket analysis for updates posted before 9 AM ET to account for any changes in the model’s outlook and in Dealer Positioning.
Good luck and good trading!
